Poll Analysis: Senate Outlook 2016
| Pres. | Senate to Dems* | Senate to GOP |
| Democratic: | 43.3% probability | 56.7% probability |
| Republican: | 5.6% probability | 94.5% probability |
| Mean of 49 seats | Mean of 51 seats |
It is way too early to make much of anything out of the 2016 Senate head-to-head polls. After all, we still have a primary season to go before we know who will be on the ballot. Still…there is just enough polling to give us an “early-first-quarter score” in the Senate races.
Currently, the Senate is controlled by Republicans, who hold 54 seats. Democrats hold 45 seats, plus Maine’s Sen. Angus King caucuses with the Democrats. In 2016, there will be 34 senatorial elections, all of the Senate’s “third class.” (There could be additional special elections as well, but I am not aware of any right now.) The current crop of Senators were elected in 2010, a Republican wave off-year election. Six years later, Republicans find themselves with 24 seats to defend and Democrats with 10 seats to defend, in a presidential election year.
I’ve spent a bit of time trying to divine the candidates most likely to appear on the ballot. In some cases, it was easy. Rand Paul will appear as the G.O.P. nominee in the Kentucky race. (You know…assuming his struggling presidential campaign continues its current trajectory.) Incumbents tend to get their party’s nomination, although there are retirements, like Sen. Harry Reid (D-NV). In some states, front-runners are obvious, like in Wisconsin where incumbent Sen. Ron Johnson (R) will almost certainly go up against former Sen. Russ Feingold (D). When there are multiple candidates, I’ve tried to use primary polls, newspaper accounts, FEC numbers, and other sources to find the strongest or most likely candidate to advance to the general. You can see which candidates I’ve advanced to the general by looking at the polls page.
I’ve found state head-to-head polls in 15 races and no polls for 19 races. Polled states tend to be the ones with the most competitive Senate races OR states with some other importance. For example, there are many polls in Iowa and New Hampshire, which are the early caucus/primary states. I’ve found a total of 69 polls to date, so clearly there are multiple polls for many of the 15 races. States without polling are assumed to go to the party currently holding the seat.
After 100,000 simulated elections, Democrats have a Senate majority 5,553 times, there were 37,718 ties, and Republicans have a Senate majority 56,729 times. In the event of a 50 seat tie, the President’s party controls (U.S. Constitution, Article I, Section 3). If Sec. Hillary Clinton wins, Democrats have a 43.3% probability of controlling the Senate and Republicans have a 56.7% probability of controlling the Senate. If Clinton loses, Republicans would almost certainly (94.5% probability) maintain control of the Senate.
The good news for Democrats is that they are likely to gain 4 seats and have a good shot of taking control if they win the presidential election. The good news for Republicans is that they are still more likely than not to control the Senate. They can either lose 4 or fewer seats or lose 5 seats plus win the presidential election.
Let’s examine a few of the races.
Arizona: Former Rep. Ann Kirkpatrick (D-AZ-01) is the likely challenger to Sen. John McCain (R). Of the three polls taken in the race, the current one leaves McCain with only a 6 point margin. Still, this leaves McCain with nearly a 90% chance of retaining his seat in a hypothetical election held now.
Florida: Ron DeSantis (R) seems to be the likely Republican nomination for the seat currently held by Sen. Marco Rubio (R). On the Democratic side, feisty former congressman Alan Grayson and Rep. Patrick Murphy (D-FL-18) are neck-in-neck. I give Murphy a small edge for the Democratic nomination. Polling show Murphy leading Ron DeSantis, and with an 88% probability of winning an election held now. I suspect this race will tighten up considerably by election day.
Illinois: Sen. Mark Kirk (R) is in the fight of his life, most likely against Rep. Tammy Duckworth (D-IL-8). Duckworth has led in the three polls taken to date. Kirk, who squeaked through in an off-year election, has a number of weaknesses that suggest he will be a one-term Senator.
Iowa: Republican Chuck Grassley is almost certainly going to beat likely Democratic challenger Rob Hogg (D). I mention this race for one reason: If Hogg does win, it means he will be serving with a more senior Sen. Joni Ernst (R) whose campaign ad start out with her talking about growing up “castrating hogs.” She promises to “cut pork” and offers to “make ‘em squeal.” The jokes write themselves. Symbolically, though, adding a Hogg in Ernst’s own state would be a hilarious symbolic victory for the Dems. I would just recommend Rob always wear a cup. But it’s all fantasy. Unless Grassley drops dead before the election, he’ll win.
Nevada: Sen. Harry Reid (D) is retiring, leaving the seat susceptible to a G.O.P. takeover. The most likely match-up seems to be Nevada AG Catherine Cortez Masto (D) against Rep. Joe Heck (R-NV-03). The most recent poll has Cortez Masto up a slim +1, but a slightly earlier poll had Heck up by +14! This promises to be a most interesting race.
New Hampshire: Sen. Kelly Ayotte (R) has had a solid lead over Gov. Maggie Hassan (D) in three of the past 4 polls, but the most recent poll puts Hassan up +1. Hassan has only led in 5 of the the 18 polls taken to date. These leads may be flukes. Alternatively, we have another fascinating race that may determine control of the Senate.
Ohio: This race will most likely be between Sen. Rob Portmann (R) and former Gov. Ted Strickland (D). Portmann has led in two of the six polls taken to date. The past three polls, going back to June, have Strickland in the lead by at least +3.
Wisconsin: Sen. Ron Johnson (R) hasn’t made much of an impression on Wisconsin voters. And former Sen. Russ Feingold (D) intends to capitalize on that to take back his old seat. Feingold has led in all seven polls taken for this race, and leads by +11 in the current poll. At this point, this race looks like a sure D pick-up.
So that’s that. If you notice any errors in this post, please leave a comment in the thread below. I am shaking down software that I haven’t used in a few years, and thinking about senate races that are still in the formative stage.
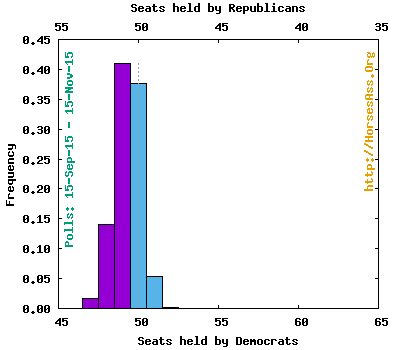
Here is the distribution of Senate seats from the simulations:*
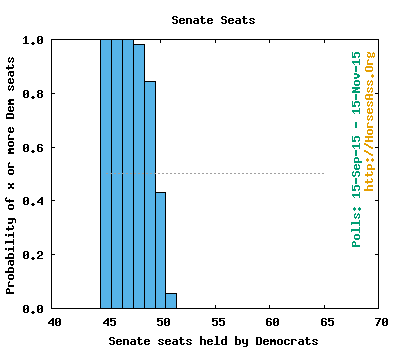
This graphs shows the probability of at least each number of seats controlled by the Democrats:*
- Average ( SE) seats for Democrats: 49.3 ( 0.8)
- Average (SE) seats for Republicans: 50.7 ( 0.8)
- Median (95% CI) seats for Democrats: 49 (48, 51)
- Median (95% CI) seats for Republicans: 51 (49, 52)
Expected outcomes from the simulations:
- Contested Democratic seats likely to remain Democratic: ten
- Contested Republican seats likely to remain Republican: 20
- Contested Democratic seats likely to switch: none
- Contested Republican seats likely to switch: four
This table shows the number of Senate seats controlled for different criteria for the probability of winning a state:*Safe>0.9999, Strong>90%, Leans>60%, Weak>50%
| THRESHOLD | SAFE | + STRONG | + LEANS | + WEAK |
|---|---|---|---|---|
| Safe Democrat | 45 | |||
| Strong Democrat | 2 | 47 | ||
| Leans Democrat | 2 | 2 | 49 | |
| Weak Democrat | 1 | 1 | 1 | 50 |
| Weak Republican | 0 | 0 | 0 | 50 |
| Leans Republican | 1 | 1 | 50 | |
| Strong Republican | 5 | 49 | ||
| Safe Republican | 44 |
This table summarizes the results by state. Click on the poll number to see the individual polls included for a state.
| # | SAMPLE | % | % | DEM | REP | ||
|---|---|---|---|---|---|---|---|
| STATE | @ | POLLS | SIZE | DEM | REP | % WINS | % WINS |
| AL | 0 | 0 | (0) | (100) | |||
| AK | 0 | 0 | (0) | (100) | |||
| AZ | 1 | 392 | 45.7 | 54.3 | 11.1 | 88.9 | |
| AR | 0 | 0 | (0) | (100) | |||
| CA | 0 | 0 | (100) | (0) | |||
| CO | 0 | 0 | (100) | (0) | |||
| CT | 1 | 1509 | 70.1 | 29.9 | 100.0 | 0.0 | |
| FL | 1& | 611 | 53.4 | 46.6 | 88.3 | 11.7 | |
| GA | 0 | 0 | (0) | (100) | |||
| HI | 0 | 0 | (100) | (0) | |||
| ID | 0 | 0 | (0) | (100) | |||
| IL | 1& | 726 | 53.9 | 46.1 | 92.7 | 7.3 | |
| IN | 0 | 0 | (0) | (100) | |||
| IA | 2 | 2522 | 33.9 | 66.1 | 0.0 | 100.0 | |
| KS | 0 | 0 | (0) | (100) | |||
| KY | 1& | 975 | 44.3 | 55.7 | 0.6 | 99.4 | |
| LA | 0 | 0 | (0) | (100) | |||
| MD | 0 | 0 | (100) | (0) | |||
| MO | 1 | 595 | 43.4 | 56.6 | 1.2 | 98.8 | |
| NV | 1& | 562 | 50.5 | 49.5 | 57.0 | 43.0 | |
| NH | 4 | 2677 | 47.1 | 52.9 | 1.8 | 98.2 | |
| NY | 0 | 0 | (100) | (0) | |||
| NC | 1 | 1002 | 43.0 | 57.0 | 0.1 | 99.9 | |
| ND | 0 | 0 | (0) | (100) | |||
| OH | 1 | 1050 | 51.7 | 48.3 | 78.7 | 21.3 | |
| OK | 0 | 0 | (0) | (100) | |||
| OR | 0 | 0 | (100) | (0) | |||
| PA | 2 | 1671 | 44.4 | 55.6 | 0.0 | 100.0 | |
| SC | 0 | 0 | (0) | (100) | |||
| SD | 0 | 0 | (0) | (100) | |||
| UT | 1& | 483 | 31.3 | 68.7 | 0.0 | 100.0 | |
| VT | 0 | 0 | (100) | (0) | |||
| WA | 1 | 335 | 65.7 | 34.3 | 100.0 | 0.0 | |
| WI | 2 | 1242 | 57.2 | 42.8 | 100.0 | 0.0 |
@ Current party in office
& An older poll was used (i.e. no recent polls exist).
*Analysis assumes that one independent candidate will continue to caucus with the Democrats.
Details of the methods are given in the FAQ.
The most recent analysis in this match-up can be found fromthis page.
With 14 more seats to defend than Democrats, it’s hard to believe Republicans won’t lose 5 of 24 in a presidential election year when turnout favors Democrats.
Darryl’s model may not take that into consideration. I thin it mainly refracts polls.
Also, looking at the states the only red ones that might turn red are PA, and Vt. While blue ones that could turn red I see weak chancea in FLA, OH, IL, WI, NV, … odds favor Red.