Using 2013 population and budget figures, I come up with nearly $160 per person, annually. For a family of 4 consisting of 2 parents and 2 children, this would amount to $640 of their annual income going to the city in the form of fines and forfeitures — not counting municipal taxes and fees.
Let’s walk through it. Ferguson’s population at the 2010 census was 21,203, of whom 67.4% were black; Wikipedia estimates its 2013 population at 21,111, and 67.4% of this would be 14,129 black residents. In 2013, the city’s revenue from fines and forfeitures was $2,571,190, according to its annual financial report. There’s no breakdown by race, of course, of who paid this; so we have to estimate it. Dividing that figure by 21,111, you get $121.80 per person; divide by 14,129 and you’ll get $181.98. Those figures represent the average amount paid per person if fines and forfeitures (a) were spread evenly across the population without race, or (b) paid entirely by the black population. The actual average is somewhere between those two numbers.
The U.S. Department of Justice report, which you can read here, found that Ferguson police disproportionately targeted blacks for traffic stops and other citations, and city officials “fixed” tickets for whites. DOJ also found many of the stops and arrests violated residents’ constitutional rights, but we’ll skip over that here, as this article’s focus is doing a mathematical calculation of how much money the city was “mining” from its mostly-poor black population through its discriminatory policing practices.
First of all, this “mining” was spread broadly across the black population; in 2013, according to the DOJ report, the Ferguson municipal court issued 32,795 warrants to 9,007 individuals. (This large number, DOJ said, “is due exclusively to the fact that the court uses arrest warrants and the threat of arrest as its primary tool for collecting” fines.) Data showed that 96% of those arrested for outstanding warrants (i.e., unpaid fines) were blacks. Citation rates were lower, roughly 80% to blacks, suggesting blacks were more likely to be unable to pay — and that few, if any, whites paid extra penalties imposed by the municipal court as a result of failure to appear or failure to pay (which no doubt are closely linked to ability to pay). Thus, probably somewhere around 85% to 90% of the total fines and forfeitures were collected from blacks. Extracting those numbers from total fines and forfeitures, then dividing by the black population, produces a range of $154 to $164 annual, per black resident. For some individuals, of course, it was less; for others, more, sometimes much more.
And keep in mind this is only Ferguson; many of the surrounding municipalities did much the same thing, and because St. Louis County is carved up (“Balkanized”) into nearly 100 different municipalities, Ferguson residents often had to travel through multiple municipal jurisdictions to get to jobs, shopping, medical care, etc. — and got hit up by the police and courts in each one. The $160 per person figure is only for Ferguson; it would be uncommon for a black Ferguson resident to not be hit up for money by multiple other jurisdictions. The DOJ report detailed specific instances of individuals who were bled for thousands of dollars by these multiple jurisdictions.
For people of limited means, this was an enormous financial burden — for a person living on a poverty income, it was devastating — exacerbated by the fact that nonpayment carried a serious risk of serving jail time. And, of course, the restrictions this system imposed on travel and mobility, and the impairment of employability caused by having a police or jail record, exacerbated the poverty of the victims of this system. These burdens were not shared by whites, either financially or in terms of arrest and incarceration or police abuse; the DOJ found that 96% of the people jailed under this collection racket were black, and every single person bitten by a police dog in Ferguson was black.
Meanwhile, the city of Ferguson devoted over half its non-capital spending to “public safety” (which, keep in mind, consisted in large part of police activities oriented to raising money for the city). Here, from the city’s 2013 annual report (linked above), are Ferguson’s 2013 budget expenditures:
- General government: $1,443,858
- Public safety: $8,066,962
- Highways and streets: $2,386,624
- Community development: $639,587
- Culture and recreation: $1,311,007
- Capital outlay: $7,457,234
- Debt service: $2,479,673
- Total: $23,781,035
If you strip out capital spending and debt service, you end up with $13,844,128 of spending on government operations, of which 58.3% went for “public safety.” While policing and street maintenance are normal functions of a city government, and typically a city government’s largest expenditures — and Ferguson isn’t different from thousands of other municipalities in this respect — it’s apparent that Ferguson residents received little in direct services in return for their taxes and fines. The City of Ferguson was a “taker” government, not unlike medieval baronies in that respect.

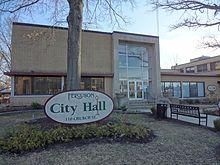
 Photos: Do you find it strange that a small city (20,000 pop.) of mostly poor people can afford municipal buildings like these? It’s not a mystery where the money went. But where are the libraries, community centers, and public facilities?