at HORSESASS— ,
 |
 |
Last week’s analysis had Sec. Hillary Clinton leading Donald Trump 309 EVs to 229 EV, and gave Clinton a 96.2% chance of winning an election held then.
About 25 new polls have been released since then, and Trump has made further gains. Now, a Monte Carlo analysis of head-to-head polls gives Clinton 78,889 wins and Trump 21,111 wins (including the 2,468 ties) out of 100,000 simulated elections. Clinton received (on average) 288 to Trump’s 250 electoral votes. In an election held now, Clinton would have a 78.9% probability of winning and Trump would have a 21.1% probability of winning.
Here are a few notes for individual states.
There isn’t a lot of good news for Clinton, but in Arizona, an old Trump+5% poll aged out, leaving a series of much closer polls. Consequently, Trump’s probability of winning the state has dropped from 92.5% to only 80.5%.
Something similar has happened in Florida. A clear outlier poll with Clinton up +14% has aged out, and we have two new polls. The tally has Clinton leading 3 and Trump leading 3 with one tie. The net result is that we went from Clinton with a 82% probability of taking the state last week to a 59% chance of Trump taking the state this week. Florida is a toss-up.
In Maine a new SurveyUSA poll gives us verification that Maine’s 2nd CD is strongly for Trump, while the 1st CD is strongly for Clinton. The CDs would split in an election held now. Overall, however, Clinton would take the state.
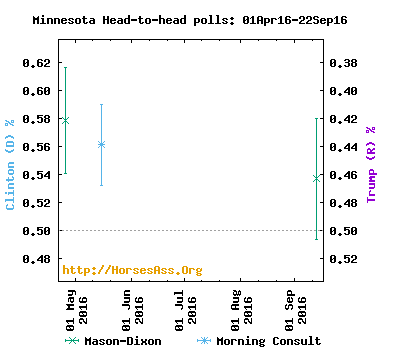
A new Mason-Dixon poll in Minnesota has Clinton at +6% over Trump. Still, the small size of the poll means that Clinton’s chances are pegged at 88%. The longer polling history suggests Clinton would easily take the state.
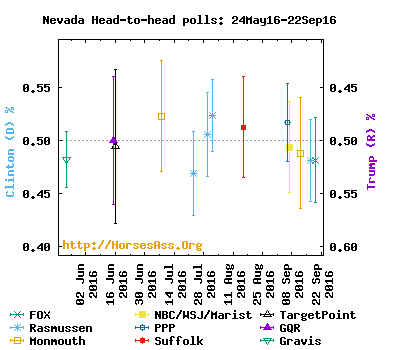
Nevada has flipped. We have five current polls, and Trump has small leads in the last four polls. Last week we gave Clinton a 63% chance of winning Nevada. Now Trump has a 68% chance. Clearly, Nevada is a swing state.
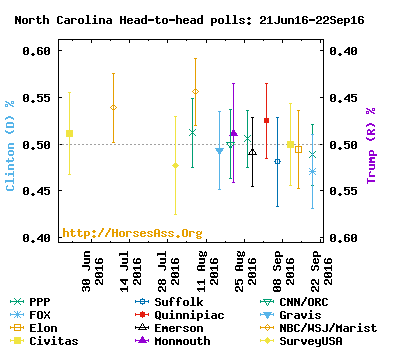
North Carolina has flipped as well. Clinton had a tenuous lead last week, with a 58% chance of taking the state. With three new polls that all go to Trump, the GOP nominee now has a 69% chance of winning the state.
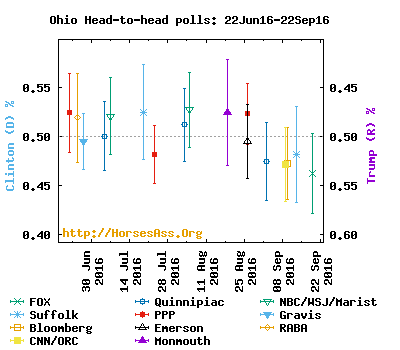
Ohio has strengthened for Trump on account of a new Trump+5% poll. Trump has led in the past 5 polls, raising his chances from 78% last week to 90% this week.
The long term trends in this race can be seen from a series of elections simulated every seven days using polls from 22 Sep 2015 to 22 Sep 2016, and including polls from the preceding month (FAQ).
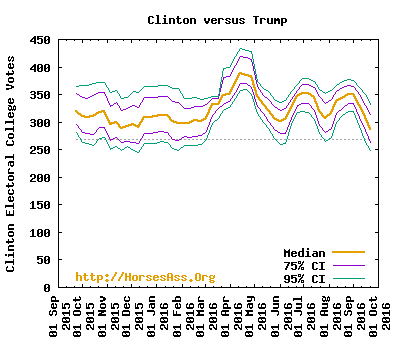
Trump is now in his strongest position of the entire election cycle, even though his chances of winning are about 1 in 5. This change reflects what we have seen in the national polls a week or two ago. Since these analyses rely on state polls, there is a lag as new polls come in and old polls drop out. The next week will be interesting to see if and where Trump “maxes out”, as Clinton seems to be recovering from her bad streak of national polls.
An animated sequence of maps and electoral vote distributions can be seen here
Here is the distribution of electoral votes [FAQ] from the simulations:
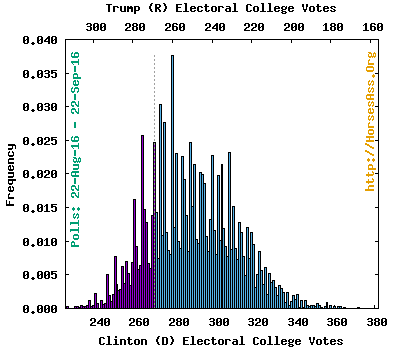
For the first time, the Trump victories are included in the top ten most probable outcomes (full distribution here).
- 278 electoral votes with a 3.77% probability
- 272 electoral votes with a 3.03% probability
- 274 electoral votes with a 2.77% probability
- 263 electoral votes with a 2.57% probability
- 287 electoral votes with a 2.47% probability
- 269 electoral votes with a 2.47% probability
- 307 electoral votes with a 2.32% probability
- 280 electoral votes with a 2.31% probability
- 298 electoral votes with a 2.27% probability
- 283 electoral votes with a 2.26% probability
After 100,000 simulations:
- Clinton wins 78.9%, Trump wins 21.1%.
- Average (SE) EC votes for Clinton: 288.3 (21.8)
- Average (SE) EC votes for Trump: 249.7 (21.8)
- Median (95% CI) EC votes for Clinton: 287 (249, 332)
- Median (95% CI) EC votes for Trump: 251 (206, 289)
Each column of this table shows the electoral vote total aggregated by different criteria for the probability of winning a state (Safe=100%, Strong=90%+, Leans=60%+, Weak=50%+):
| THRESHOLD | SAFE | + STRONG | + LEANS | + WEAK |
|---|---|---|---|---|
| Safe Clinton | 143 | |||
| Strong Clinton | 92 | 235 | ||
| Leans Clinton | 28 | 28 | 263 | |
| Weak Clinton | 9 | 9 | 9 | 272 |
| Weak Trump | 29 | 29 | 29 | 266 |
| Leans Trump | 54 | 54 | 237 | |
| Strong Trump | 122 | 183 | ||
| Safe Trump | 61 |
This table summarizes results by state. Click on the poll count to see the individual polls included for the state.
| 1 | 0 | EC | # | TOTAL | % | % | CLINTON | TRUMP | |
|---|---|---|---|---|---|---|---|---|---|
| 2 | 8 | VOTES | POLLS | VOTES | CLINTON | TRUMP | % WINS | % WINS | |
| AL | 9 | 1* | 3690 | 36.7 | 63.3 | 0.0 | 100.0 | ||
| AK | 3 | 1* | 435 | 37.5 | 62.5 | 0.0 | 100.0 | ||
| AZ | 11 | 5 | 3398 | 49.0 | 51.0 | 19.5 | 80.5 | ||
| AR | 6 | 1 | 516 | 33.7 | 66.3 | 0.0 | 100.0 | ||
| CA | 55 | 3 | 5076 | 62.4 | 37.6 | 100.0 | 0.0 | ||
| CO | 9 | 2 | 865 | 50.1 | 49.9 | 51.2 | 48.8 | ||
| CT | 7 | 1 | 847 | 58.8 | 41.2 | 100.0 | 0.0 | ||
| DE | 3 | 1* | 529 | 56.7 | 43.3 | 98.4 | 1.6 | ||
| DC | 3 | 1* | 1131 | 76.5 | 23.5 | 100.0 | 0.0 | ||
| FL | 29 | 7 | 4292 | 49.8 | 50.2 | 41.4 | 58.6 | ||
| GA | 16 | 4 | 1911 | 47.8 | 52.2 | 10.0 | 90.0 | ||
| HI | 4 | 1* | 801 | 61.9 | 38.1 | 100.0 | 0.0 | ||
| ID | 4 | 1 | 403 | 34.2 | 65.8 | 0.0 | 100.0 | ||
| IL | 20 | 2 | 1240 | 60.2 | 39.8 | 100.0 | 0.0 | ||
| IN | 11 | 1 | 474 | 45.6 | 54.4 | 9.0 | 91.0 | ||
| IA | 6 | 3 | 1559 | 48.5 | 51.5 | 20.2 | 79.8 | ||
| KS | 6 | 1 | 498 | 43.2 | 56.8 | 1.6 | 98.4 | ||
| KY | 8 | 1* | 425 | 42.4 | 57.6 | 1.3 | 98.7 | ||
| LA | 8 | 2 | 928 | 43.6 | 56.4 | 0.3 | 99.7 | ||
| ME | 2 | 2 | 1266 | 53.7 | 46.3 | 97.2 | 2.8 | ||
| ME1 | 1 | 2 | 636 | 62.1 | 37.9 | 100.0 | 0.0 | ||
| ME2 | 1 | 2 | 638 | 45.5 | 54.5 | 5.1 | 94.9 | ||
| MD | 10 | 1 | 590 | 68.6 | 31.4 | 100.0 | 0.0 | ||
| MA | 11 | 2 | 832 | 62.9 | 37.1 | 100.0 | 0.0 | ||
| MI | 16 | 4 | 2307 | 53.2 | 46.8 | 98.5 | 1.5 | ||
| MN | 10 | 1 | 513 | 53.6 | 46.4 | 88.2 | 11.8 | ||
| MS | 6 | 1* | 987 | 42.9 | 57.1 | 0.0 | 100.0 | ||
| MO | 10 | 3 | 2498 | 44.9 | 55.1 | 0.0 | 100.0 | ||
| MT | 3 | 1* | 1153 | 44.1 | 55.9 | 0.2 | 99.8 | ||
| NE | 2 | 1* | 1093 | 42.5 | 57.5 | 0.1 | 99.9 | ||
| NE1 | 1 | 0* | (0) | (100) | |||||
| NE2 | 1 | 0* | (0) | (100) | |||||
| NE3 | 1 | 0* | (0) | (100) | |||||
| NV | 6 | 5 | 2812 | 49.4 | 50.6 | 32.5 | 67.5 | ||
| NH | 4 | 6 | 3052 | 53.5 | 46.5 | 99.8 | 0.2 | ||
| NJ | 14 | 1 | 715 | 52.0 | 48.0 | 77.7 | 22.3 | ||
| NM | 5 | 1* | 783 | 56.3 | 43.7 | 99.6 | 0.4 | ||
| NY | 29 | 2 | 1176 | 61.5 | 38.5 | 100.0 | 0.0 | ||
| NC | 15 | 8 | 5371 | 49.5 | 50.5 | 31.3 | 68.7 | ||
| ND | 3 | 1 | 300 | 42.7 | 57.3 | 3.2 | 96.8 | ||
| OH | 18 | 7 | 4680 | 48.6 | 51.4 | 9.7 | 90.3 | ||
| OK | 7 | 1 | 445 | 41.1 | 58.9 | 0.3 | 99.7 | ||
| OR | 7 | 1 | 325 | 60.3 | 39.7 | 99.5 | 0.5 | ||
| PA | 20 | 7 | 4232 | 53.0 | 47.0 | 99.7 | 0.3 | ||
| RI | 4 | 1 | 678 | 51.5 | 48.5 | 70.9 | 29.1 | ||
| SC | 9 | 2 | 1811 | 42.1 | 57.9 | 0.0 | 100.0 | ||
| SD | 3 | 1* | 657 | 40.9 | 59.1 | 0.0 | 100.0 | ||
| TN | 11 | 1* | 2191 | 40.5 | 59.5 | 0.0 | 100.0 | ||
| TX | 38 | 2 | 906 | 45.6 | 54.4 | 3.1 | 96.9 | ||
| UT | 6 | 1 | 381 | 38.1 | 61.9 | 0.0 | 100.0 | ||
| VT | 3 | 1 | 439 | 64.9 | 35.1 | 100.0 | 0.0 | ||
| VA | 13 | 4 | 2628 | 51.8 | 48.2 | 90.6 | 9.4 | ||
| WA | 12 | 1* | 335 | 64.2 | 35.8 | 100.0 | 0.0 | ||
| WV | 5 | 1* | 309 | 38.8 | 61.2 | 0.3 | 99.7 | ||
| WI | 10 | 4 | 2249 | 53.3 | 46.7 | 98.4 | 1.6 | ||
| WY | 3 | 1 | 293 | 25.9 | 74.1 | 0.0 | 100.0 |
* An older poll was used (i.e. no recent polls exist).
Details of the methods are given in the FAQ.
The most recent analysis in this match-up can be found fromthis page.