Poll Analysis: Clinton versus Bush
 |
 |
There have only been something over a dozen new state head-to-head polls since the previous analysis of a general election match-up between Secretary Clinton and Gov. Bush. Previously, the race was, essentially, tied with Clinton having a slight edge. This month, the race is, well…tied. But now Bush has a slight advantage.
The trend can be seen from this graph created from a series of elections simulated every seven days using polls from 16 Oct 2014 to 16 Oct 2015, and including polls from the preceding month (FAQ).
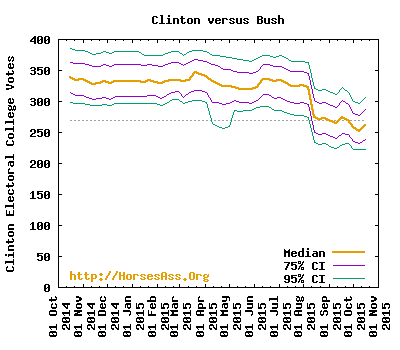
In the month and a half since the previous analysis, the race has remained a tie, with a bounce in Bush’s favor followed by a bounce in Clinton’s favor. There isn’t much we can make of these bounces statistically. All of the data in the recent polls were collected before the Democratic debate, so we cannot even pretend the uptick in favor of Clinton is related to the debate. What is clear, however, is that this past summer, Clinton lost a significant edge she held over Bush.
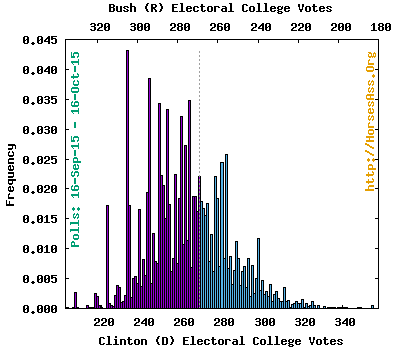
For the most recent period, the 100,000 simulated elections, puts Clinton ahead 35,187 times and Bush ahead 64,813 times (including the 2,215 ties). Clinton received (on average) 263 to Bush’s 275 electoral votes. In an election held now, Clinton would have a 35.2% probability of winning and Bush would have a 64.8% probability of winning.
Here is the distribution of electoral votes [FAQ] from the simulations:
Ten most probable electoral vote outcomes for Clinton (full distribution here):
- 233 electoral votes with a 4.32% probability
- 244 electoral votes with a 3.85% probability
- 264 electoral votes with a 3.48% probability
- 249 electoral votes with a 3.43% probability
- 253 electoral votes with a 3.32% probability
- 260 electoral votes with a 3.22% probability
- 262 electoral votes with a 2.73% probability
- 282 electoral votes with a 2.58% probability
- 280 electoral votes with a 2.45% probability
- 257 electoral votes with a 2.24% probability
After 100,000 simulations:
- Clinton wins 35.2%, Bush wins 64.8%.
- Average (SE) EC votes for Clinton: 262.6 (20.9)
- Average (SE) EC votes for Bush: 275.4 (20.9)
- Median (95% CI) EC votes for Clinton: 262 (223, 307)
- Median (95% CI) EC votes for Bush: 276 (231, 315)
Each column of this table shows the electoral vote total aggregated by different criteria for the probability of winning a state (Safe=100%, Strong=90%+, Leans=60%+, Weak=50%+):
| THRESHOLD | SAFE | + STRONG | + LEANS | + WEAK |
|---|---|---|---|---|
| Safe Clinton | 142 | |||
| Strong Clinton | 81 | 223 | ||
| Leans Clinton | 10 | 10 | 233 | |
| Weak Clinton | 11 | 11 | 11 | 244 |
| Weak Bush | 36 | 36 | 36 | 294 |
| Leans Bush | 31 | 31 | 258 | |
| Strong Bush | 150 | 227 | ||
| Safe Bush | 77 |
An animated sequence of maps and electoral vote distributions can be seen here
This table summarizes results by state. Click on the poll count to see the individual polls included for the state.
| 1 | 0 | EC | # | TOTAL | % | % | CLINTON | BUSH | |
|---|---|---|---|---|---|---|---|---|---|
| 2 | 8 | VOTES | POLLS | VOTES | CLINTON | BUSH | % WINS | % WINS | |
| AL | 9 | 0 | (0) | (100) | |||||
| AK | 3 | 4* | 2547 | 45.9 | 54.1 | 0.3 | 99.7 | ||
| AZ | 11 | 1* | 492 | 50.0 | 50.0 | 50.8 | 49.2 | ||
| AR | 6 | 4* | 3756 | 48.2 | 51.8 | 6.2 | 93.8 | ||
| CA | 55 | 2* | 1546 | 57.2 | 42.8 | 100.0 | 0.0 | ||
| CO | 9 | 1* | 948 | 46.7 | 53.3 | 8.5 | 91.5 | ||
| CT | 7 | 1* | 1062 | 60.5 | 39.5 | 100.0 | 0.0 | ||
| DE | 3 | 0* | (100) | (0) | |||||
| DC | 3 | 0* | (100) | (0) | |||||
| FL | 29 | 3 | 2255 | 46.8 | 53.2 | 1.6 | 98.4 | ||
| GA | 16 | 1* | 797 | 49.4 | 50.6 | 41.7 | 58.3 | ||
| HI | 4 | 0* | (100) | (0) | |||||
| ID | 4 | 1* | 433 | 39.7 | 60.3 | 0.1 | 99.9 | ||
| IL | 20 | 1* | 810 | 55.2 | 44.8 | 98.3 | 1.7 | ||
| IN | 11 | 0* | (0) | (100) | |||||
| IA | 6 | 2 | 2094 | 47.1 | 52.9 | 3.3 | 96.7 | ||
| KS | 6 | 5* | 4536 | 44.8 | 55.2 | 0.0 | 100.0 | ||
| KY | 8 | 1* | 975 | 45.4 | 54.6 | 2.1 | 97.9 | ||
| LA | 8 | 1 | 752 | 40.4 | 59.6 | 0.0 | 100.0 | ||
| ME | 2 | 1* | 838 | 63.2 | 36.8 | 100.0 | 0.0 | ||
| ME1 | 1 | 0* | (100) | (0) | |||||
| ME2 | 1 | 0* | (100) | (0) | |||||
| MD | 10 | 1* | 682 | 59.8 | 40.2 | 100.0 | 0.0 | ||
| MA | 11 | 1 | 378 | 65.1 | 34.9 | 100.0 | 0.0 | ||
| MI | 16 | 1 | 1172 | 53.2 | 46.8 | 93.6 | 6.4 | ||
| MN | 10 | 1* | 873 | 51.2 | 48.8 | 69.4 | 30.6 | ||
| MS | 6 | 2* | 1077 | 46.5 | 53.5 | 5.4 | 94.6 | ||
| MO | 10 | 1* | 748 | 46.0 | 54.0 | 6.0 | 94.0 | ||
| MT | 3 | 1* | 868 | 42.2 | 57.8 | 0.1 | 99.9 | ||
| NE | 2 | 0* | (0) | (100) | |||||
| NE1 | 1 | 0* | (0) | (100) | |||||
| NE2 | 1 | 0* | (0) | (100) | |||||
| NE3 | 1 | 0* | (0) | (100) | |||||
| NV | 6 | 1* | 582 | 57.0 | 43.0 | 99.0 | 1.0 | ||
| NH | 4 | 1 | 950 | 46.1 | 53.9 | 5.1 | 94.9 | ||
| NJ | 14 | 3* | 2943 | 61.2 | 38.8 | 100.0 | 0.0 | ||
| NM | 5 | 2* | 1232 | 58.5 | 41.5 | 100.0 | 0.0 | ||
| NY | 29 | 1* | 727 | 59.6 | 40.4 | 100.0 | 0.0 | ||
| NC | 15 | 3 | 2571 | 47.6 | 52.4 | 4.5 | 95.5 | ||
| ND | 3 | 0 | (0) | (100) | |||||
| OH | 18 | 1 | 991 | 48.8 | 51.2 | 31.1 | 68.9 | ||
| OK | 7 | 0 | (0) | (100) | |||||
| OR | 7 | 1* | 832 | 58.7 | 41.3 | 100.0 | 0.0 | ||
| PA | 20 | 2 | 1763 | 49.6 | 50.4 | 40.7 | 59.3 | ||
| RI | 4 | 0 | (100) | (0) | |||||
| SC | 9 | 1* | 937 | 44.1 | 55.9 | 0.6 | 99.4 | ||
| SD | 3 | 0* | (0) | (100) | |||||
| TN | 11 | 0* | (0) | (100) | |||||
| TX | 38 | 1* | 393 | 43.5 | 56.5 | 3.7 | 96.3 | ||
| UT | 6 | 1* | 538 | 25.8 | 74.2 | 0.0 | 100.0 | ||
| VT | 3 | 0* | (100) | (0) | |||||
| VA | 13 | 1 | 950 | 48.3 | 51.7 | 22.4 | 77.6 | ||
| WA | 12 | 2* | 1593 | 55.6 | 44.4 | 99.9 | 0.1 | ||
| WV | 5 | 1* | 999 | 42.2 | 57.8 | 0.0 | 100.0 | ||
| WI | 10 | 1 | 710 | 56.9 | 43.1 | 99.5 | 0.5 | ||
| WY | 3 | 1* | 1071 | 34.8 | 65.2 | 0.0 | 100.0 |
* An older poll was used (i.e. no recent polls exist).
Details of the methods are given in the FAQ.
The most recent analysis in this match-up can be found fromthis page.


