(Washington is one of the) “dumb, dumber, dumbest” states, for having recorded our poorest rates of investment in higher education over the last two fiscal years. In FY 2010, we spent $5.48 per $1000 of personal income in this state on higher education. That’s 63.7% below our peak of $15.53 in FY 1974.
Perhaps the clearest consequence of the thirty-year choice that policy makers in Washington and other states have made to disinvest in public higher education has been the exacerbation of the gap between those who are born with stuff and those who have to work for it.
from UFWS blog: So the House budget proposal was unveiled on Monday, and, well, it could have been worse. Don’t get us wrong, here at the blog we still feel that tax loopholes should be on the table (giving money to out of state banks and private jet folks while people go hungry and die is, no matter how hard you squint, just wrong), that there ought to be a more serious and sustained effort to reform the goofiest tax system in the country, and that every proposed budget this year is just another step in the destruction of our crucial public infrastructure.
But . . . given the local problem of creating a budget within ridiculous constraints, Rep. Ross Hunter and the House Dems did a remarkable job. Obviously not everyone is going to buy into all the choices, but this budget has a coherence and clarity that we haven’t seen in a while.
For our state universities, the House budget whacks $100 million more than the Governor’s proposal did. But a tip of the blog hat to Representative Hunter and his colleagues for making the extent of the cuts clear. You don’t have to dig into the murky footnotes to find how the details of pension adjustments and salary reductions add up to more than the advertised cut. The full damage was right up front in the presentation that Representatives Hunter, Darneille, and Sullivan made at their press conference. The slide showing the higher ed cuts had a big asterisk making it clear that the cut percentages included all the back of the book stuff.
The other great thing that the House budget presentation did was make it clear that state spending and public services continue to shrink. State spending per person is the lowest it’s been since 1986 and dropping. Remember that the next time somebody tells you that state spending is out of control.
And while state spending has been dropping steadily, spending on higher education has dropped precipitously. With both the governor’s and the house budget proposals out now, the writing on the wall is pretty clear. When the smoke clears on this year’s legislative session, state support to our public universities will have been cut by 50% or more in the last two biennia.
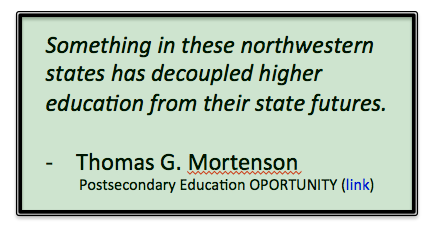
To understand the consequences of this disinvestment, we need only turn our eyes to Oskaloosa, Iowa, the home of Tom Mortenson, publisher of the newsletter Postsecondary Education Opportunity [link] . Since 1991, Mortenson’s newsletter has “relentlessly calculated, documented, and reported” the consequences of state disinvestment in higher education over the last two decades. Mortenson lists Washington as one of his “dumb, dumber, dumbest” states, for having recorded our poorest rates of investment in higher education over the last two fiscal years. In FY 2010, we spent $5.48 per $1000 of personal income in this state on higher education. That’s 63.7% below our peak of $15.53 in FY 1974.
Perhaps the clearest consequence of the thirty-year choice that policy makers in Washington and other states have made to disinvest in public higher education has been the exacerbation of the gap between those who are born with stuff and those who have to work for it. As Mortenson points out:
This decline in state investment in higher education has occurred during the Human Capital Era of the U.S. economy. Since 1973 income and the welfare that income provides has been based almost entirely on educational attainment, particularly higher education. Since 1973 the real incomes and living standards of people of all genders and races and ethnicities, families, households, cities, and states have been reallocated according to educational attainment. Those with the most education have prospered and moved farther ahead, while those with the least education have suffered and fallen further behind. Higher education has become the distinct line of demarcation between those moving forward and the rest moving backward in their incomes, health, wealth, and general welfare.
This race to the bottom will continue this year, no matter what budget is ultimately adopted. The House budget proposal cuts between 3.2% and 5.4% from the total budgets of each of our universities and raises tuition by 11.5% to 13% just to keep those cuts from being worse.
So, while the House budget writers did a good and thoughtful job, the bottom line is still that our students will be paying 11% to 13% more to get 3% to 5% less.
The organizing and education that members of the higher education community have done has made higher ed more of a priority for legislators. But if we’re going to preserve the future of this state through the middle class expansion and economic, political and cultural development that access to high-quality, publicly supported universities brings, we still have a lot of work to do.